Orbyx #
Orbyx is a Graph Visualization project written with Python and JavaScript. It’s main focus is extensibility with plugins.
Prerequisites #
Before you get started with Orbyx, make sure you have the following prerequisites installed on your system:
- Git
- Python
Installation #
Clone the Orbyx repository and navigate into the directory:
python3 -m venv env
source env/bin/activate
pip install -r requirements.txt
./run.sh
Adding more plugins #
First, you need to decide which kind of plugin you want to add. If you decide to go with a Data Source plugin, you need to create a class which will implement DataSourceAPI (api/services/data_source_api). Or perhaps you could choose to write a Visualizer plugin, then you will need to create a class which will implement Visualizer (api/services/visualizer_api)
DataSourceAPI #
class DataSourceAPI(ABC):
    @abstractmethod
    def get_name(self) -> str:
        """Abstract property for the name of the data source"""
        pass

    @abstractmethod
    def get_requirements(self) -> List:
        """Abstract method for the name that will return list of dependencies necessary."""
        pass

    @abstractmethod
    def parse_data(self, data: Any) -> List[Dict[str, Any]]:
        """Method that will parse data and consturct a graph"""
        pass

    @abstractmethod
    def get_graph(self, parsed_data: List[Dict[str, Any]]) -> Graph:
        """Method that will send data to the plugin and recieve a graph"""
        pass
DataSourceAPI #
class Visualizer(ABC):
    @abstractmethod
    def get_name(self) -> str:
        """Abstract property for the name of the visualizer"""
        pass

    @abstractmethod
    def visualize(self, graph: Graph) -> Any:
        """Abstract method for data visualization"""
        pass
After that you will need to put it in a folder and add a setup.py file for it. It should contain these lines:
- ‘orbyx_tinywiki’: [’template=tinywiki.engine:WikipediaDataSource’] - example if you’re writting a data source plugin
- ‘orbyx_visualizer_plugin’: [’template=visualize.generate_template:BlockVisualizer’] - example if you’re writting a data source plugin
Optionally, you want to add dependencies which are required for your plugin.
That’s it! You’re ready to enjoy Orbyx.
Currently written plugins #
- Tinywiki - Wikipedia Data Source which scrapes wikipedia until its found N number of nodes, it only works with en.wikipedia articles.
- Java Data Source - Written with antlr, data source which will go through your java project and make a graph from it.
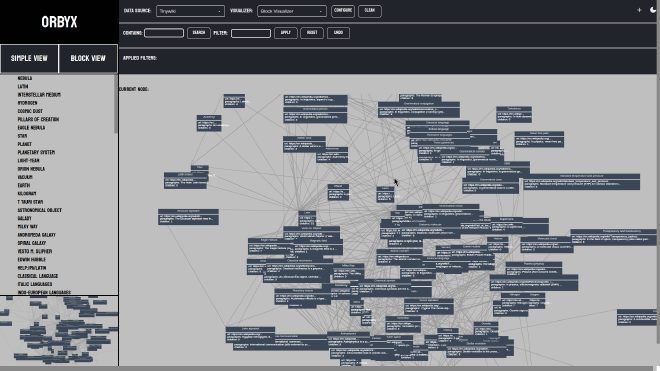
- Block Visualizer - Visualizer which will make visualization for your graph with squares containing content of the graph node.
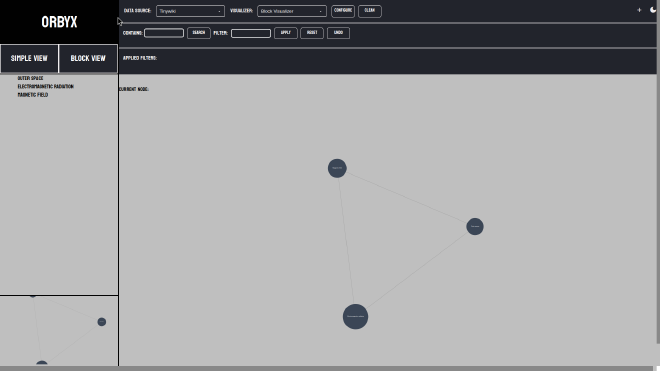
- Simple Visualizer - Visualizer which will make blob-like visualization using your graph nodes.
Additional Views #
- Tree View - Displays data in a Tree like way, similar to popular IDEs or text editors, located on left of the web application.
- Bird View - Minimized view of the entire graph, which traces your zoom with a red rectangle.
Gallery #


